Ultimate Loads
This calculation scans a number of load cases to find the maximum and minimum values of a specified set of variables, and records the simultaneous values of all the other variables in the list.
From the Ultimate Loads window, click Define Channels and Load Cases to open the Multiple Processing window. Use the Add Load Case and Add Variable buttons to build up the required lists of
load cases and variables.
A list of Load Case Groups can be set up along with their corresponding safety factors. A check box on the Load Cases tab enables these to be assigned to the load cases. During processing the safety factors will then be applied. Safety factors may also be assigned to individual variables, and these will override the group safety factor.
Each load case should have a unique identifier. If Load Case Groups have been defined, the identifier will attempt to set itself to a
sensible default, which the user is free to change if required. For each variable, specify whether its maximum and minimum are to be found.
If Load Case Groups have been used, an additional check box on the Variables tab allows the safety factor associated with the extreme load to be reported in the extreme loads tables.
If a blade manufacturer has provided a load configuration file, this can be used to produce custom output for that particular blade.
It is also possible to combine blade loads across all blades. With this option the maximum and minimum loads across all blades will be reported.
The output from this calculation consists of an ASCII text file with many rows and columns. The file name will be directory\runname.$mx where the directory and runname are entered at the time of running the calculation. The file is suitable for importing directly
into a spreadsheet, and can also be tabulated using the Multiple Plots feature. Additional output is available in the form of histogram plots, which present comparison between the load cases group. A drop down list on the Load Cases tab allows the desired type of histogram output to be selected.
A check box allows IEC-3 Sub Groups to be turned on. This allows the user to group several simulations together and request that Bladed finds a representative simulation that is either closest to the mean of maxima across all simulations within the group, or one that
is closest to the mean of the top half across all simulations within the group. This is shown in Figure 1. Bladed will identify the groups by an identification string used within the path or the run name, and these should be entered in the appropriate text box on the Load Case Groups tab.
With the IEC-3 Sub Groups box checked, two methods for combining the loads across Bladed are offered on the “Variables” tab:
The default method “Combine after evaluating subgroups” will have Bladed first get the representative simulation of a sub group for each blade as explained above, and then pick the largest extreme load across all blades.
The method “Combine before evaluating subgroups” will have Bladed first select the largest extreme simulations across all blades and then get the representative simulation of a subgroup.
Figure 2 illustrates both methods where the maxima of Mx blade root is plotted against the simulation names for a three blade turbine. In this example the sub group consists of six simulations: aa_1 to aa_6. The “_” character in the load case name was defined in the Load case Groups tabs to be the identification text for a MEAN type subgroup.
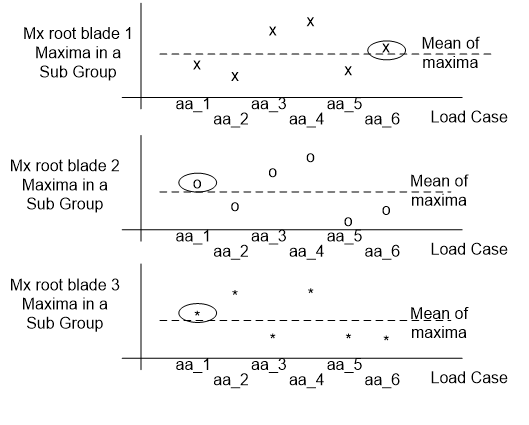
In this first method, the simulation closest to the mean of maxima is selected as the representative simulation for each blade (circled in the diagrams above). The simulation with the largest maximum between all three of the circled representative simulations is finally selected.
Combine before evaluating subgroups method
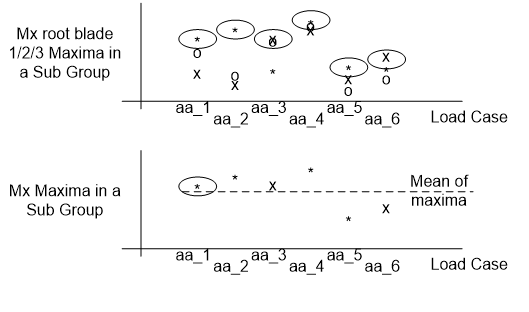
In this second method, the simulations are combined across the blades first. That is the blade with the largest maximum is selected for each load case as shown in the top diagram above. Then the simulation closest to the mean of the maxima of these six selected simulations is found and circled in the bottom diagram.
You can also use the Ultimate Load Cases calculation to process one or more Ultimate Loads output files and give a graphical presentation of results.
Ultimate Load Case
This calculation generates a list of maxima and minima of loads and the load cases in which they occur.
In the Ultimate Load Cases window, click Add... to select output
files from ultimate loads calculations. Select the required variables
from the list of available variables.
To view the results, click the Data view icon on the main toolbar
and select the Special graph type. Then find the calculation results
by clicking Channel 1. The results will be presented as a histogram.
Last updated 15-11-2024