Introduction to Bladed User Interface
On starting Bladed, the main Toolbar appears together with the Calculations screen as shown in Figure 1. The Toolbar consists of a set of graphical icons and a number of pull-down menus. The Calculations screen allows the user to select, define and execute a particular calculation.

There are various ways of opening further screens which allow the user to define the characteristics of the various parts of the turbine, as well as the characteristics of the wind and various parameters which control the execution of calculations. There is also a graphics facility for viewing results.
Main Toolbar and Pull-Down Menus
The pull-down menus may be used as follows:
File: Use this menu to create, open and save project files, and to import modules from other project files. A project file (.prj) contains wind turbine information and/or parameters defining calculations. Using the file type selector on the File Open dialogue box, it is also possible to open a project backup file (.prx), or a file containing all the details relating to a calculation previously carried out (.$pj). This is useful for re-running the calculation with or without modifications.Use the
Importfacility to import individual modules from other project or calculation details files into the currently active project.The project file header information may be entered or edited using Project Info. The Encrypt facility allows any part of the turbine model to be encrypted with a password, so that the data can still be used for calculations but is completely invisible to the user. If necessary, different parts of the turbine can be encrypted by different users, each with a separate password. To make data visible again, use
Decryptand enter the correct password.Specify: This menu allows the user to move directly to a particular screen for specifying any part of the turbine, or any calculation or load case. These screens are also accessible via the Toolbar Icons described below.Calculation: This menu allows particular calculations to be carried out. See also the Calculation icon on the main toolbar described below. It also allows unwanted calculation results to be deleted.Batch: This is used to control batch processing of multiple runs.Reports: This menu also offers the possibility to write a project report or a calculation report, to append graphs to a report, and to edit or print existing reports. It also gives a choice of report format, which may be ASCII or Microsoft Word.Tools:Copy resultsallows calculation results to be copied from one location to another. In doing so, the results can be converted between binary and ASCII formats if required. There is also a facility toDelete results.Compare Projectsallows two project and/or calculation details files to be compared, and can generate a detailed report of the differences. `Create Header Files launches a tool to create header files for multiple ASCII data files so that Bladed post processing and data view can be used. There is also a facility for configuring the current printer, and to specify user preferences for certain option settings.Windows: Switches between any of the currently open windows, and gives access to the turbine summary information window and to the 3D graphical display (which can be animated using the double-arrow icon).Help: Activates the on-line Help facility, which contains detailed information on Bladed and how to use it. It also gives on-line access to the Bladed User and Theory manuals, and to a facility for upgrading the dongle or security device by entering an appropriate password.
Toolbar Icons
Beneath the pull-down menus on the toolbar are the Toolbar Icons. Clicking on any one of these opens up the corresponding screen, as follows:
- Blades to define the blade properties.
Aerofoil sections to access a database of aerofoil section data.
Rotor to define the properties of the rotor and overall turbine configuration.
Tower and support structure to define the tower properties of the support structure.
Power train to define the drive train, generator, energy losses and electrical network.
Nacelle to define the nacelle geometry and mass.
Control to define both power production and supervisory control systems.
The wind input to define the wind speed and direction including spatial and temporal variations.
Flexibility Modeller to specify the modal analysis of blade and tower/support structure vibrations.
Calculations to select, specify and execute any particular calculation.
Data View to view graphs or generate tables of results.
Analyse is used for post-processing calculation results.
Entering data
In each window, data is entered by typing in the required information in the fields provided. Where there is a choice of alternative options, selection buttons or pull-down selectors are provided. In some cases check boxes are provided for enabling or disabling particular items (the item is selected when a tick appears in the box).
Where numerical values are entered, except in the case of dimensionless numbers, the units in which the data is to be specified are shown. Double-clicking on the entry brings up a units conversion box, allowing the user to enter values in a choice of different units.
Once data in a window has been edited, it is necessary to assign the
changes by clicking the OK button. Alternatively, any changes made
since the data was last assigned may be reversed by clicking the
Cancel button.
Using Project Files
A project file stores all the currently defined information relating to the turbine, the wind field information, and calculation parameters. Click OK on any open windows to ensure that the data is assigned before saving to a project file. Project files have a .prj extension.
When a calculation is performed, all the information which is of relevance to that calculation is stored in a special calculation project file which is stored with the calculation results. This file will have a $pj extension, and can be loaded just like a standard project file.
A project report may be generated from the Reports pull-down menu on the main toolbar.
Viewing results
After a calculation has been completed, the results can be viewed by clicking the Data View icon on the toolbar, and selecting the desired data for each channel. Up to six channels may be plotted on one graph. The outputs from any calculation just completed will normally be selected by default. Otherwise, the dialogue box allows any drive and directory to be selected. If the results of several calculations are available within the directory, a pull-down selector allows the user to choose the run name which was specified when the calculation was initiated.
The output files available from that calculation are shown in the Data Group window. Selecting one of these displays a contents list for the file from which the user chooses the variable of interest. Click OK to assign the data to the selected graph channel.
Often there is just one independent variable, for example Time in the case of dynamic simulations. Sometimes there is a choice of independent variables: for example a blade bending moment from a simulation could be plotted either against time or radius. Double-click to change the choice of independent variable.
If two independent variables are defined, a three-dimensional graph will result. Three-dimensional plots are most useful for small datasets.
The View Messages button displays any warning or error messages generated during the run. In a few cases, some additional information is available by clicking the Further Info button. Other buttons allow whole runs or individual data groups to be deleted.
Compiling Reports
If Microsoft Word is installed, it is possible to generate neatly formatted project and calculation reports in Word format. It is also possible to insert calculation results into these reports, either as tables or as graphs. See user preferences.
If Word is not available, change the report format to ASCII using the Reports pull-down menu. This will cause reports to be generated in tab-delimited ASCII format, suitable for reading into other packages if required. This option does not allow graphs to be inserted into the report.
Reports are generated from the Reports pull-down menu on the main
toolbar. There are two types of reports:
Project reports: these may contain any currently assigned modules defining the turbine itself, as well as calculation parameters and wind field details if required.Calculation reports: these may be generated for any calculation which has been carried out, or which is awaiting execution in the Batch queue. A dialogue box allows the desired calculation to be selected Calculation reports may include any turbine details which are relevant to the calculation, as well as details of the calculation itself and the wind field used if applicable. They may be generated as stand-alone reports, or appended to another report such as a project report.
When reports are generated, they may be appended to existing report files if desired. Thus it is possible to create a project report, and subsequently append calculation reports to it whenever calculations are done, and also append calculation results either as graphs or tables.
Data Encryption
Any part of the turbine data may be encrypted, using a password entered by the user. Encrypted data becomes invisible to the user, but can still be used to run calculations. It can only be decrypted by entering the correct password. To encrypt data, click the Encrypt button on the appropriate data entry screen. You will first be prompted for an encryption group name, which identifies the encrypted data. Each encryption group has its own password, so it is possible for different users, perhaps different component suppliers, to encrypt their own data. When a new encryption group is created, the user is prompted to enter a password, and then to verify it. Passwords are case-sensitive. If an existing group is selected, the user must be able to enter the correct password in order to add more data to the group.
Bladed then offers the user the possibility to specify to disable certain simulation outputs, in case this output data is thought to give too much away. For example a blade manufacturer may choose to encrypt the blade data, and might decide to prevent subsequent calculation results from including the blade loads or deflections, or to allow blade loads only the root station for example, or deflections only at the tip. Of course it is important not to restrict the calculation outputs so far that the calculations are no longer useful. Encryption of the blade data automatically causes the rotor mode shapes to be encrypted, and encryption of tower data causes the tower mode shapes to be encrypted. Modal frequencies remain visible to the user.
To decrypt data, either click the Decrypt button on the appropriate data entry screen, or use the File ... Decrypt pull-down menu on the toolbar and choose which encryption group to decrypt. The correct password then needs to be entered.
User Preferences
Select Tools > Preferences from the main toolbar menu, and select desired options as follows:
Standard Tab
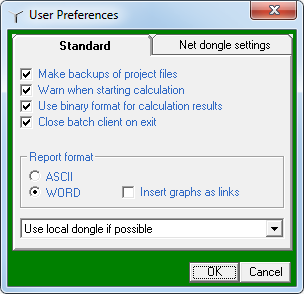
Make backups of project files: to make a backup file (.prx) whenever a project file (.prj) is opened.Warn when starting calculation: to display a warning when a shelled calculation is about to start.Use binary format for calculation results: binary output is faster and results in smaller files.Close batch client on exit: On exit of Bladed: Close Batch Viewer, and unless this machine is the manager of the batch, also close the Batch Framework, resulting in aborting running jobs and removing this machine as a runner of the batch.Report format: Select ASCII or WORD.Insert graphs as links: to append graphs to WORD reports as links to external metafiles. If this option is not selected, graphs will be fully imported into the WORD document.Dongle search order dropdown: specifies whether to use a local dongle, network dongle or favour a local dongle over a network dongle (in the latter case if a local dongle is not found, Bladed will search for a network dongle). If you have a network dongle you can change the way in which the network is searched by clicking the Net dongle settings tab.
Last updated 26-11-2024