Net energy Monte Carlo simulation
Energy results in the Energy calculation task include effects on the yield that can be calculated with the WindFarmer models. However, there are additional losses to be considered in the final wind farm net yield. Furthermore, when it comes to financing wind farms, the uncertainty in the annual wind farm energy yield needs to be considered, usually described by so-called exceedance levels (P-values) that define the yield that is exceeded with specific probabilities.
WindFarmer: Analyst allows you to define uncertainties and efficiencies and run a Monte Carlo simulation to predict the net energy probability distribution, following the DNV method.
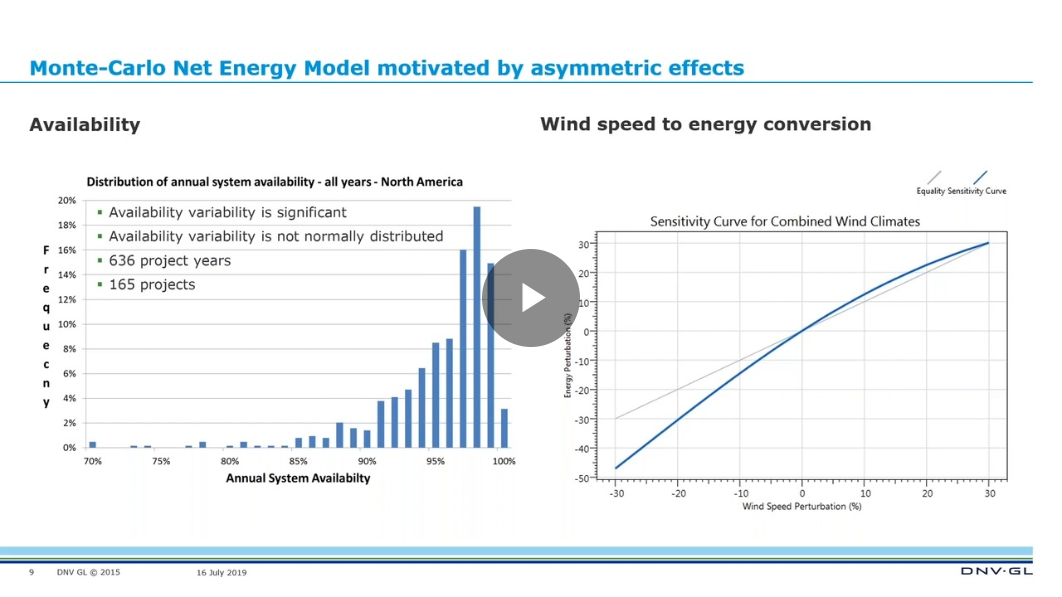
In the DNV Monte Carlo net energy simulation we typically model 500,000 possible future wind farm energy production outcomes to build a net energy distribution and predict the annual P99, P90, P50 net energy yields and other statistics needed for financial modelling. The Monte Carlo Net Energy calculation can simulate the impact of non-linear effects such as availability and wind speed to energy sensitivity.
The uncertainty and efficiency inputs to this model are all defined as distributions. For efficiencies, this allows you to define the uncertainty in the loss factor. You can set efficiency distribution truncations to limit the minimimum and maximum possible efficiency.
$$\mathrm{\textrm{Efficiency}} = 1 - \textrm{loss} $$
To predict each of the possible 500,000 energy production outcomes we generate sample of random numbers with the properties of each input uncertainty or efficiency (loss) distribution independently. Values from each distribution are combined together with the gross yield to predict a net yield outcome.
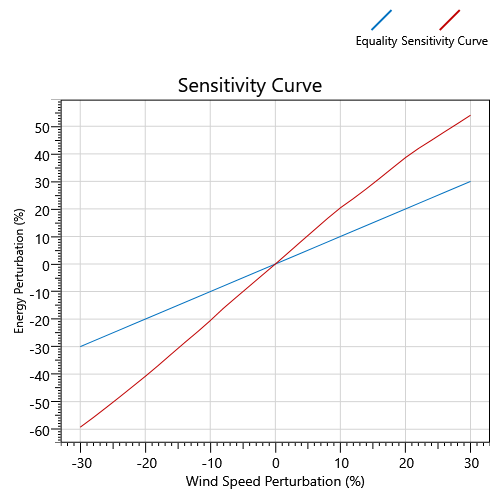
Wind speed deviations from wind speed uncertainties are combined then converted to energy before propagating through the model. The conversion factor is via a sensitivity which provides the wind speed perturbation to energy perturbation conversion. This curve flattens off at higher wind speeds, like a turbine power curve. Traditional assumptions of a sensitivity ratio, or straight-line wind speed-to-energy conversion factor get this relationship wrong. WindFarmer: Analyst derives this sensitivity curve specifically for your project within the wake and energy modelling so the exact curve will depend on several factors including the power curve and the frequency distribution.

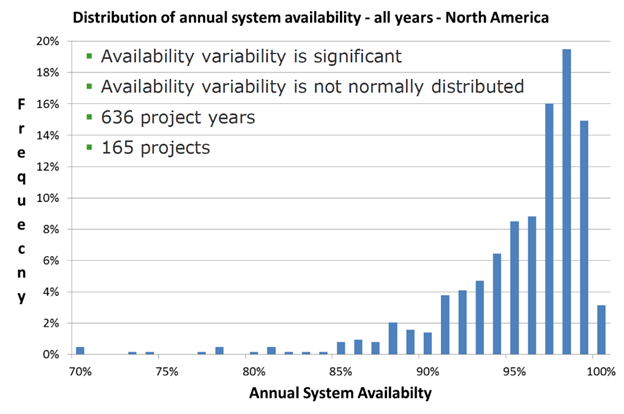
The distribution of availability has a long tail as a small subset of projects seriously underperform. It is clear that availability is not a normal distribution so we cannot use simple assumptions to combine the uncertainty in availability with other uncertainties. We commonly model availability loss as a Weibull distribution: the efficiency distribution is therefore a mirror image of a Weibull.

The Monte Carlo Net Energy model supports time varying efficiencies by simulating (by default) 500,000 wind farm outcomes for each year of operation of the wind farm. If your availability, turbine degradation or tree growth efficiencies vary through the project lifetime, either in the mean value or uncertainty, then the net energy distribution will also vary through the lifetime of the project.
