Wind Flow Visualisation
The wind flow visualisation task visualises your wind flow model for a selected inflow direction after any initiations and wind speed adjustments. The visualisation represents the speedups used in the wake calculation to determine relative wind speed differences between turbines.
| Wind flow controls | Description |
|---|---|
| Reference wind direction | The wind direction is chosen by the clicking and dragging to rotate the wind flow control dial. |
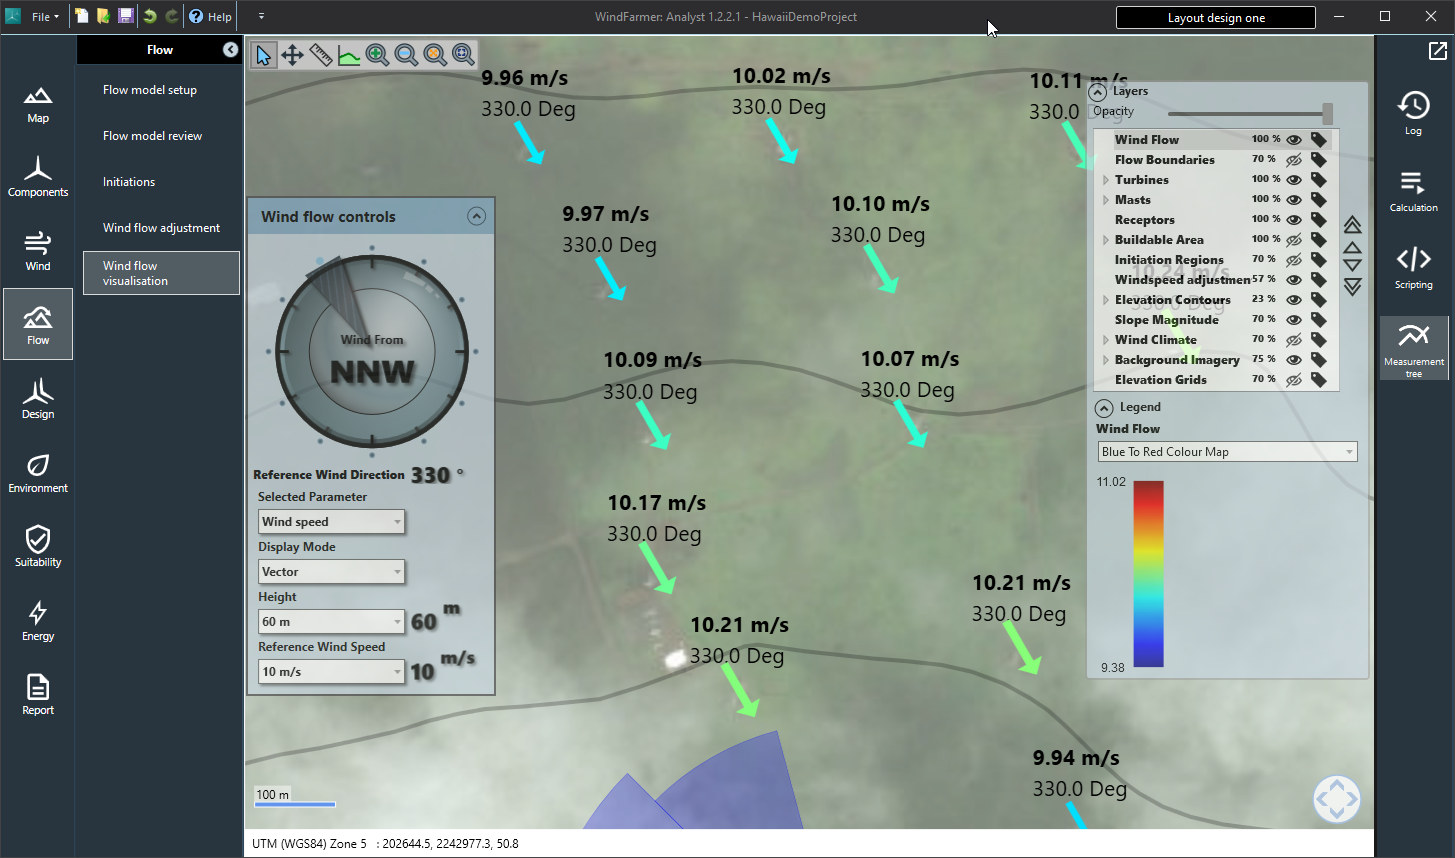
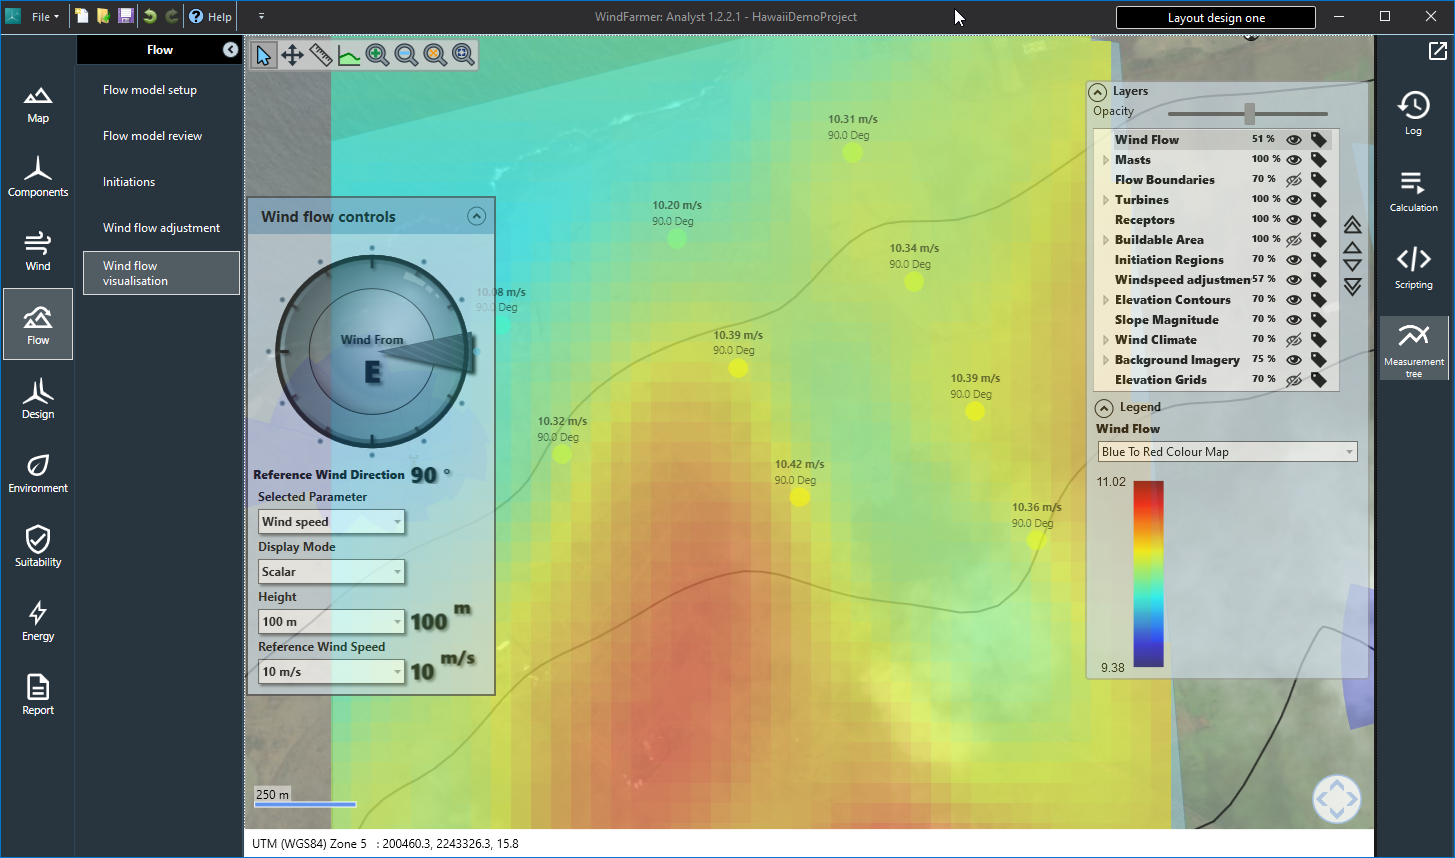
| Display mode | In the above image above we can see a wind flow grid using the scalar display mode. The vector displays of streamlines or wind vector arrows. The image below shows discrete predictions using the vector setting. |
| Height | If you have more than one turbine hub height in your project, you should select the height you wish to view in the wind flow controls. |
| Reference wind speed | The wind speeds visualised are relative to a wind speed of 10 m/s at the reference mast: they are not mean wind speeds. |

Note
If you have multiple measurement sites you may see some discontinuity in the wind flow as wind speeds at each initiating measurement site are set at 10 m/s. We intend to reduce such discontinuities through introduction of a mast-to-mast speedup model.
