The measurement tree
The measurement tree is accessed from the right hand toolbar and it allows you to review, manage and export the meteorological data at measurement sites in the workbook.
Export data
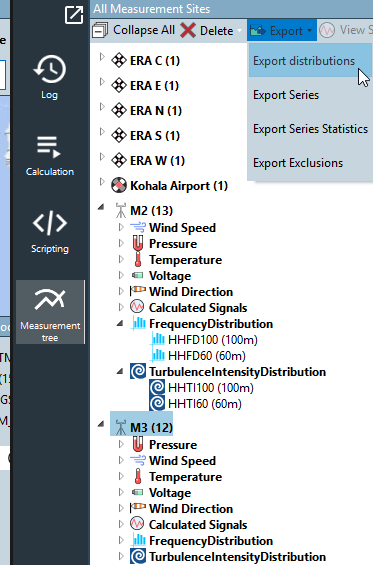
You can export data for all child measurements, signals or distributions under the selected node, or multi-selected nodes (with ctrl + click).
Export Distributions
Export Distributions allows you to export frequency distributions (tab) and turbulence intensity distributions (.wti). Select a measurement site to export all child distributions to a chosen folder. You may also export multi-selected distributions or a single selected distribution. Distributions are exported respecting the settings defined in the Calculate Wind Climate task.
You can select the .gha format as an alternative to the .tab or .wti files. GHA files provides 12 wind speed and direction frequency tables, one for each calendar month in addition to a 13th annual table.
Export time series statistics
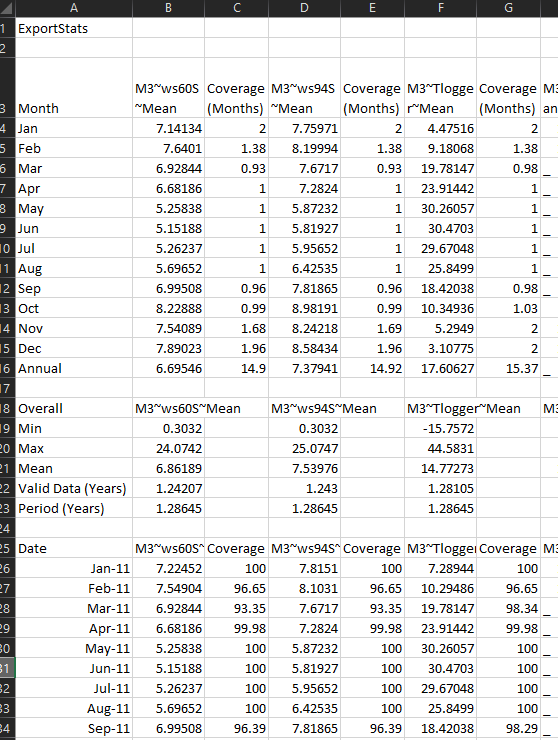
Export time series statistics allows you to create a tab separated text file containing the data coverage and important statistics that describe each time series. Stats are only derived for mean signals if you select a higher-level node.
Export Series
Export Series joins any selected time series together and exports them as columns with a shared time step. The exported time series file is continuous containing padding values for any missing data.
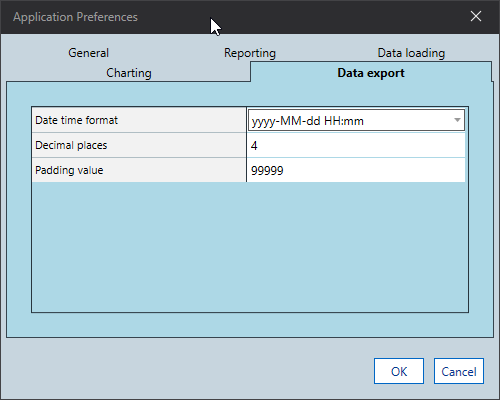
Default time series export settings can be defined in File > Preferences > Data export.
Export Exclusions
Export an exclusion file for the selected nodes. The file is a tab separated and Date-times use the format yyyy-MM-dd hh:mm:ss. Exclusion files may also be exported and imported in the Data Cleaning task.
The columns in an exclusion file are:
- Measurement Site Name
- Measurement name
- Exclusion reason
- Exclusion start date-time
- Exclusion end date-time
- Last modified date-time
View signal
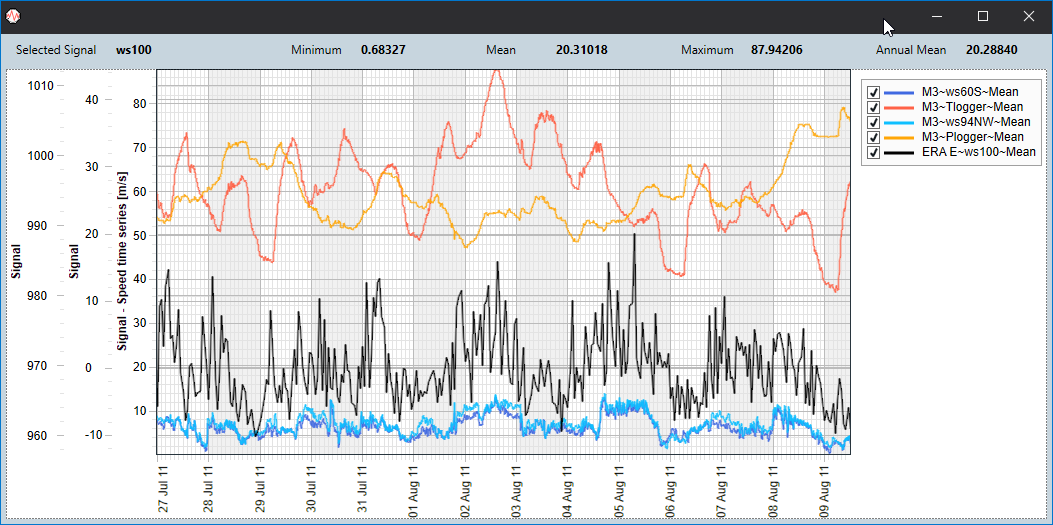
View signal allows you to visualise different data types quickly on the same time series plot to quickly check trends. It is currently the only way to visualise calculated signals as these can't yet be plotted (and cleaned) in the Data Cleaning task.
Delete unwanted data
Note that deleting a measurement site would delete all child nodes. You have tools to delete all child signals from higher level nodes without deleting those nodes.
Last modified dates
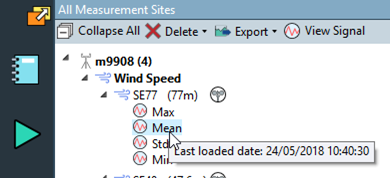
Last modified dates can be viewed by hovering over a signal. For measured data this is set when data loading. The last calculated date is saved for calculated time series and viewable in the same way.
