Calculate wind climate
Calculate wind climate is an important task where we define the measured wind climate data used in later calculations. Our Wind Climate object provides a description of the wind at a single height on a measurement site, containing a frequency distribution and, optionally, a turbulence intensity distribution. Later in the Flow chapter wind flow predictions at turbines are also stored on the wind climates. The frequency distributions defined here are used as inputs to wind flow calculations and annual energy production calculations. The turbulence intensity distributions are used by eddy viscosity wake model and design equivalent turbulence calculations.
There are 2 key workflows supported in this task to define the wind climate:
- Import wind climate data files derived in external tools: you can import .tab frequency distributions and .wti turbulence distribution files to skip earlier tasks in the wind chapter.
- Calculate long-term, hub-height wind climate data using hub height wind speed time series, reconstructed wind direction time series, the long term annual wind speeds and the shear model defined in earlier tasks.
Calculate wind climate workflow overview
Calculate or import distributions:
- Use the Auto-setup tool to rapidly generate frequency distributions and turbulence intensities at every Mast, LIDAR and SODAR for each hub height time series.
- Calculate further frequency distributions and turbulence intensities required using manual setup.
- Import distributions generated in external tools.
Review wind roses and other plots of the calculated distributions by generating a Word report.
Check and refine the tabulated settings.
If required distributions can be exported to file using the measurement tree.
In a later session you may wish to:
Use Recalculate all to recalculate the distributions after the time series used to create them have been updated in earlier tasks. Use this rather than Auto-setup to preserve any refined settings and manually setup distributions.
Try different options: You can have one active frequency distribution and one active turbulence intensity distribution at one height on a measurement site. Toggling the activate setting allows you to select different distributions to test the impact of different inputs.
Import distributions
You can import .tab frequency distributions and .wti turbulence distribution files to skip earlier tasks in the wind chapter.
- Click the import distributions above
- Select distribution files to import for one measurement site. For frequency distributions select .tab or .gha files, for wind turbulence intensities select .wti files.
- Select the measurement site to load the data into.
- Confirm the height above ground for the distributions (this data is within the .tab file but not the .wti file)
- Click ok to import then review the distributions in the table and generate a report to visualise them.
- Repeat for other measurement sites and frequency distributions / turbulence intensity distributions.
Also see wind analysis in an external tool.
Auto-setup wind climate calculations
The auto-setup tool in calculate wind climate allows you to rapidly the calculate long-term hub-height frequency distributions and hub-height turbulence intensity distributions that will be needed for flow and energy modelling.
Wind speed and direction frequency distributions and turbulence intensities are derived from every hub height time series data at each measurement site location. Calculated wind climate data are stored as HHFD(height) and HHTI(height) where the height comes from the height of the wind speed time series signal. If there are no hub height time series primary wind speed measurement height time series data are used instead.
To calculate turbulence intensity distributions, we require a wind speed standard deviation signal on the measurement site. Auto-setup selects the standard deviation (StdDev) signal from the primary wind speed measurement: if you need to use an alternative signal use manual setup.
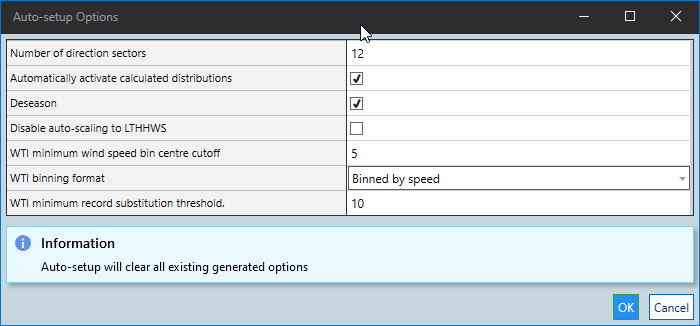
Auto-setup options
The Auto-setup options define defaults to apply to the generated distributions. The settings can be edited for individual distributions after calculation, also see Tabulated wind climate settings.

| Auto-setup option | Description |
|---|---|
| Number of direction sectors | Default 12, generally a factor of 360. Note that WAsP works with a maximum of 36 sectors. |
| Automatically activate calculated distributions | If true, the generated distributions are activated, replacing previously active distributions in the wind climates. Default true |
| Deseason | If true, seasonal bias is removed from activated distribution if there are data measured in every calendar month of the input time series data. |
| Disable auto-scaling to LTHHWS | A long-term hub-height wind speed is calculated from the long term wind speed measurement height wind speed and overall shear for the hub height time series. Calculated distributions are rescaled to have this annual wind speed by default. |
| WTI minimum wind speed bin centre cut off | Turbulence intensities derived for wind speeds below this bin are ignored when defining the mean turbulence intensity. For example if this setting is 5 m/s then turbulence intentisities derived for wind speeds below 4.5 m/s are ignored when calculating the overall mean turbulence intensity. |
| WTI binning format | When activating the distribution, the turbulence data is averaged into a binned look-up table that is used in the eddy viscosity wake and design turbulence calculations. |
| WTI minimum record substitution threshold | If a bin has less than this number of records the mean turbulence value is substituted for the overall mean turbulence. |
Manually setup wind climate calculations
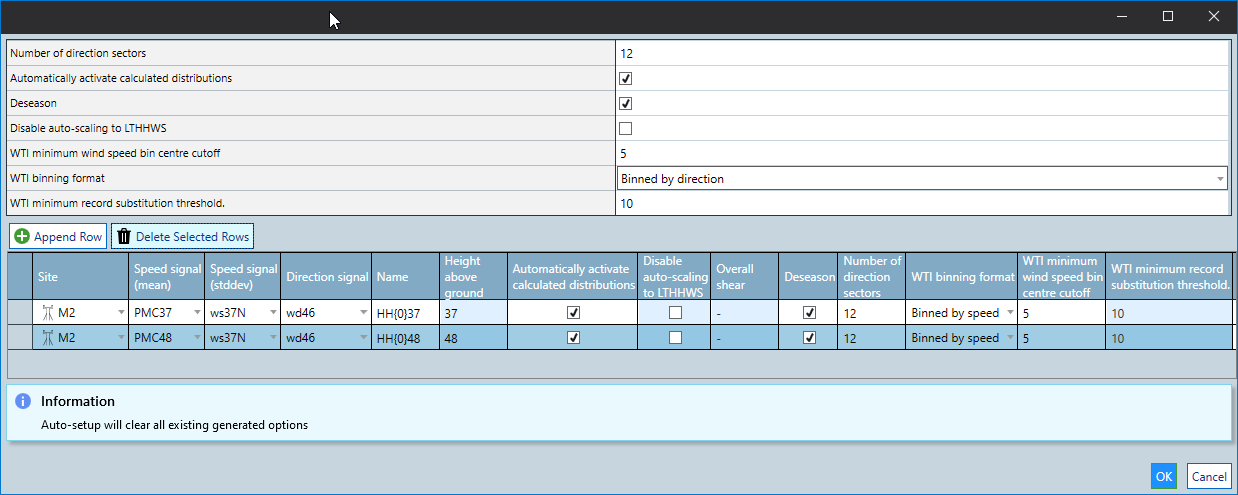
The first table of settings in the manual setup pop-up is the same as you see in auto-setup, but it only defines defaults for distributions you add to the list in the table.
For each row in the table WindFarmer: Analyst will generate a frequency distribution and turbulence intensity distribution when you click OK and save them on the selected measurement site at the height of the selected speed signal (mean).
See the below tabulated wind climate settings for information about options in each column.
Tip
- Ignore the info box message which refers to auto-setup. It will be removed in a later release.
- If you get an error because of a clash of names with existing distributions either 1) go back to the table and delete those distributions or 2) define a different name before selecting the desired wind speed signal. Once you see this error you will need to re-start the auto-setup process as it currently does not clear on updates.
Tabulated wind climate settings
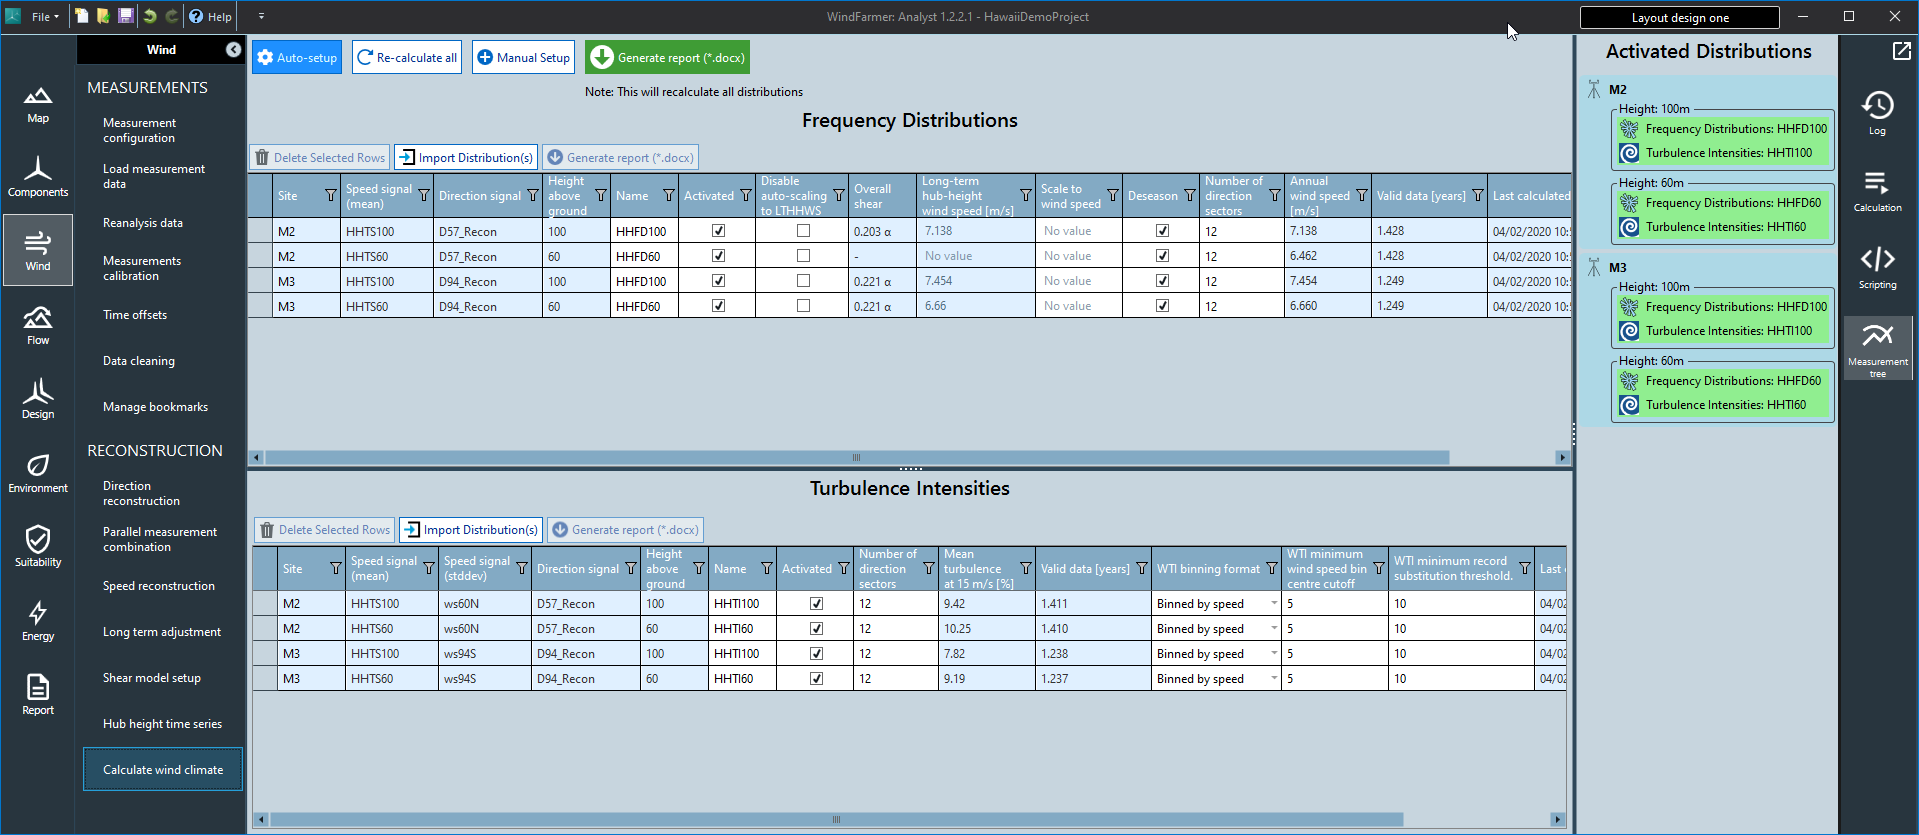
After calculating wind climate data, the following settings are available in the frequency distribution tables to allow you to review and refine your approach. The calculation options are read-only for imported data.
General settings:
| Activated | You can have one activated distribution at one height on one measurement site. Activation means this frequency or turbulence distribution will be used in flow and energy calculations. See how the wind climates detailed on the right go green when turbulence intensity and frequency distributions are activated for a height. You cannot run flow or energy calculations without a frequency distribution in each wind climate, although turbulence intensities are not required for Park or fixed eddy viscosity wake calculations |
| Number of direction sectors | Enter any value you like but note that it is advised to use something which is a factor of either 360 or 180 sectors (e.g. your setting to be used in the energy calculation). Note that the maximum that can be used by WAsP is 36 sectors. |
| Valid data [years] | The amount of wind speed data that went into the distribution, including records where no direction data were available. |
Frequency distribution specific table settings:
| Disable auto-scaling to LTHHWS | A long-term hub-height wind speed is calculated from the long term wind speed measurement height wind speed and overall shear for the hub height time series. Calculated distributions are rescaled to have this annual wind speed by default. |
| Overall shear | The overall shear for the hub height time series used to calculate the frequency distribution. Used to define the Long-term hub-height wind speed. This field is blank if the distribution was created from measured data or if the measured wind speed data are at hub height so there is no extrapolation. |
| Long-term hub-height wind speed | Calculated by extrapolating the long-term wind speed at measurement height, derived in the Long term adjustment task, to the frequency distribution height using the overall shear parameter. |
| Scale to wind speed | Specify an absolute wind speed to scale the frequency distribution to. This overrides any auto scaling to long-term hub-height wind speeds. |
| Deseason | If checked, seasonal bias is removed from the frequency distribution and the overall frequency distribution used in later calculations is derived from the weighted combination of frequency distributions from each calendar month. If there is a calendar month with no data then deseasoning is impossible and you cannot apply this setting |
| Annual wind speed | Deseasoning = true: Analogous to the Mean of Monthly Means. This is the Mean wind speed derived from the overall wind speed frequency distribution, which in turn is derived from the days-in-month weighted combination of the monthly frequency distributions stored in WFA. Deseasoning = false: analogous to the arithmetic mean. |
Turbulence specific:
| Mean turbulence at 15 m/s [%] | The mean all-directional turbulence derived for wind speeds between 14.5 and 15.5 m/s. This useful for checking turbulence levels in for site conditions. |
| WTI binning format | When activating the distribution, the turbulence data is averaged into a binned look-up table that is used in the eddy viscosity wake and design turbulence calculations. |
| WTI minimum wind speed bin centre cut off | Turbulence intensities derived for wind speeds below this bin are ignored when defining the mean turbulence intensity. For example if this setting is 5 m/s then turbulence intentisities derived for wind speeds below 4.5 m/s are ignored when calculating the overall mean turbulence intensity. |
| WTI minimum record substitution threshold | If a bin has less than this number of records the mean turbulence value for this bin is replaced with the overall mean turbulence. |
Scaling frequency distributions to long-term hub-height wind speeds
A long-term hub-height wind speed (LTHHWS) is calculated from the long term wind speed measurement height wind speed, derived in the long-term adjustment task, and overall shear (alpha or z0) for the hub height time series. Calculated distributions are rescaled to have this target annual wind speed by default. The effective overall shear value which is calculated when extrapolating time series to hub height. This is a more robust method that allows us to (in some cases) reduce uncertainty by deriving long-term measurement height wind speeds in the long-term adjustment task using a different wind speed time series to that used to create the hub height wind climate.
If you do not want to use this approach disable the auto-scaling to LTHHWS. You can also override the target wind speed. These options are highlighted for 2 frequency distributions below, note their impact on the annual wind speed of the final frequency distribution:

A detailed flow chart for this calculation is shown below, including 2
options where we either have an overall shear value in the shear model
and another where this is backcalculated during extrapolation of the hub height
time series. An equivalent process is followed for log-law calculations.

Generate reports to visualise distributions
To see wind rose and turbulence visualisations for all distributions or selected distributions generating reports from the UI in the Calculate Wind Climate task. The colours of the wind rose have been optimised for grayscale printing:
 |
 |
Turbulence intensity plots
Turbulence Intensity Comparison report
Extra turbulence intensity distribution comparisons are available at the bottom of the calculate wind climate report. There is an overall mean turbulence by wind speed comparison and a turbulence by calendar month comparison.
 |
 |
 |
Trouble shooting
Removing unwanted empty wind climates
It is possible through some wind flow setup workflows to create empty unwanted wind climates, because they do not contain frequency distributions these are invalid and block energy calculations. To remove them import a .tab file into measurement site holding the empty wind climate at the empty wind climate height then de-activate the imported frequency distribution in the table.


