Shear model setup
To extrapolate measured wind speed data from measurement height to turbine hub heights we use a shear model. In the shear model setup task we configure and calculate shear for every measurement site in the workbook where we expect to need to extrapolate data.
Shear workflow overview
The workflow for shear analysis in WindFarmer: Analyst is as follows:
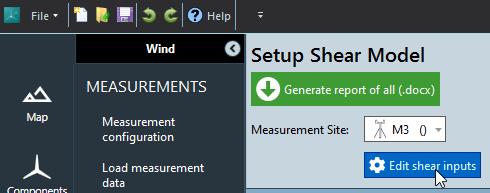
Select the measurement site for analysis and click Edit shear inputs to begin.
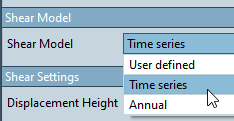
Select the shear model, time series is recommended in many cases.
For Annual and Time series shear options you then define the calculation settings:
If relevant enter the forestry displacement height at the mast (see Flow > Forestry displacement heights).
Select the measured wind speed time series you want to include when fitting the shear model. You can include one wind speed per height. For masts we normally pick either parallel measurement combined (PMC) data or measurements with the same exposure to mast effects.
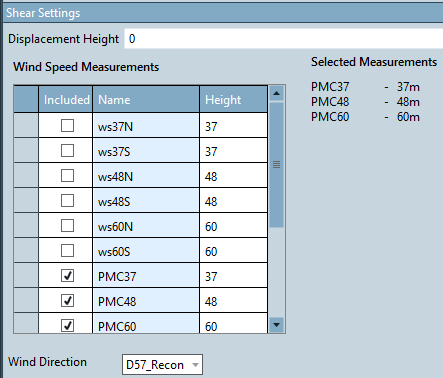
Define wind speeds to use for a hub height wind speed check of the extrapolation. Note that this is only a check, extrapolation to hub height happens in the later hub height time series task.
Define other settings specific to the shear model type (see below)
Calculate shear and review the plots. If you wish to see further tabulated shear data you can generate a Word report.
Based on your review you can edit shear settings and re-calculate again, for example if you see you have outlier measurements at a particular height.
At a later date, after loading more measurements, you can recalculate wind shear with the same settings. Select the measurement site where you want to recalculate then click Recalculate Shear.
Shear model types
| Shear model type | Description |
|---|---|
| User defined | Specify a log-law or power law shear model by specifying z0 or α. |
| Time series | The time series shear model consists of a time series of power law α values and a lookup table to fill any gaps in the time series when the shear model is used in the extrapolation to hub height. |
| Annual | A simple shear model derived by fitting the shear profile through the annual wind speeds at all heights that are selected as inputs. The result is a single annual shear parameter, either α (when you select the power law) or z0 (when you select the log law) |
User defined shear model
The user defined shear model allows you to specify a log-law or power law shear model by specifying a single value for z0 or α for the selected measurement site.
Annual shear model
The annual shear model is a simple shear model derived by fitting the shear profile through the annual wind speeds at all heights that are selected as inputs.
The result is a single annual shear parameter, either α (when using the power law) or z0 (when using the log law). When extrapolating a time series to hub height using the annual shear model the same speedup factor is applied to each time series record.
Note
- Prior to calculating the annual wind speeds each input wind speed time series is matched with the others.
- The annual wind speed is either the Mean of monthly means if there is data in each month of the year or the arithmetic mean if not.
Time series shear model
The time series shear model consists of a time series of power law α values and a lookup table to fill any gaps in the time series when the shear model is used in the extrapolation to hub height. The α value used to extrapolate wind speeds to hub height is then time dependent.
Lookup table settings

When you extrapolate a wind speed time series to hub height using the time series shear model, sometimes the alpha time series has fewer records than the wind speed time series you are trying to extrapolate. In these cases, missing time series shear-alpha values are extracted from a lookup table. The lookup table is formed by binning and averaging the alpha time series.
The lookup table can be binned either by direction or by time of day and month of year. You can review the directional and diurnal shear variation plots in the UI or report generated from a script to help choose the most appropriate shear binning mechanism.
Optional annual wind shear correction to time series shear model
If you see large discrepancies between the hub height wind speeds predicted by the time series model and the annual shear model you may choose to apply the optional annual shear adjustment factor.
When running the time series shear model you will notice a setting:

This will apply an adjustment factor to the extrapolated wind speed time series such that the annual wind speed of the extrapolated time series is the same as that predicted by the (more simple) annual shear model, whilst preserving the time series shear variation which impacts the shape of the extrapolated wind speed frequency distribution.
In the fitted annual shear profile plot with the
Advanced time series shear model settings
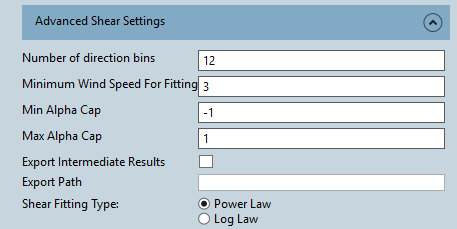
The following advanced shear settings are available, all have sensible defaults:
| Advanced shear setting | Description |
|---|---|
| Number of direction bins | Effects the directional wind shear variation plot and directional lookup table (if you have selected this binning option). |
| Minimum wind speed for lookup table | When the highest height wind speed measurement speed is below this value the time series alpha value calculated will not be used to in creating the lookup table. |
| Min alpha cap / Max alpha cap | To guard against erroneous extreme alpha values causing unrealistic hub height wind speed predictions and hence bias you can cap the min and max time series alpha value. |
| Export intermediate results | For validation purposes this exports the raw and capped alpha time series and lookup tables. |
| Shear fitting type | Sets the fitting type for the profile plotted in the the "Fitted annual shear profile plot". If you choose to apply the annual shear adjustment to the time series shear model, this also defines the fitting type for the correction. The default is power law, but you can also derive corrections from log‑law annual shear. |
Shear review plots
Fitted annual shear profile
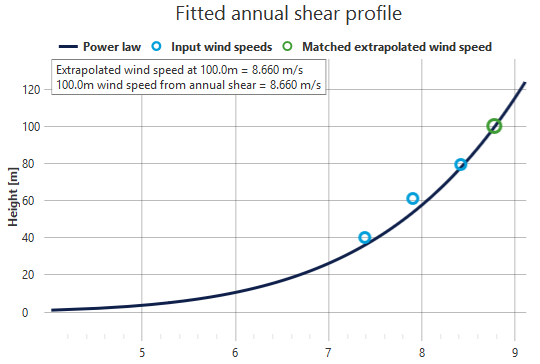
The fitted annual shear profile plot allows you to check your model for outliers.
The black line shows the power or log law profile fit to the input annual
wind speeds, shown as

Hub height wind speed check settings
The hub height wind speed check allows you to compare the hub height wind speed predicted by your shear model (e.g. the time series shear model) against the profile predicted by the simple Annual Shear Model.
In the shear input settings you can choose a wind speed time series to extrapolate to a chosen hub height.

On the Fitted annual shear profile plot the
Additional information is provided in the text box. This indicates the hub height wind speeds (not matched) predicted by the chosen shear model and overall alpha value. If you are using the time series shear model the annual shear model results are also shown for comparisson.
Seasonal wind shear variation
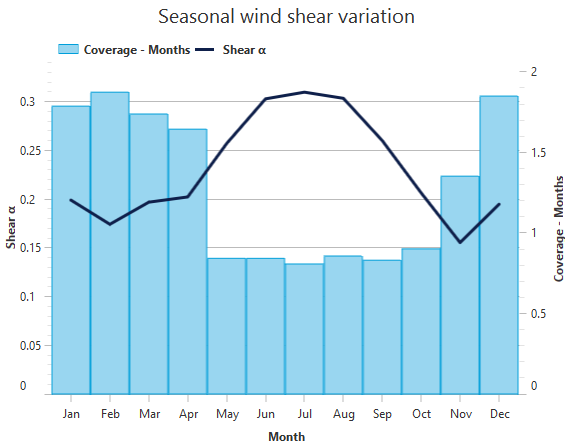
The seasonal wind shear variation plot shows how measured shear varies by calendar month. Data coverage, measured in complete months of data expected for the input time series, is also shown to help you determine if you may have a problem with seasonal bias.
For time series shear model alpha for each month is the mean of alpha values calculated in that calendar month.
For the annual shear model alpha or z0 for each month is derived from mean wind speeds for each calendar month calculated from the matched input wind speeds. In this case the plot is for information only: the data are not used in the annual shear model.
Diurnal wind shear variation
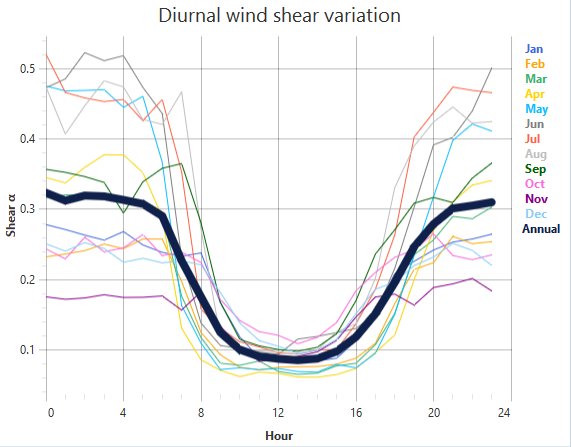
The diurnal shear variation plot is shown for the time series shear model. The annual line shows the average time series alpha value calculated for any given hour of the day. The other lines show shear variation by hour in specific months of the year.
Directional wind shear variation
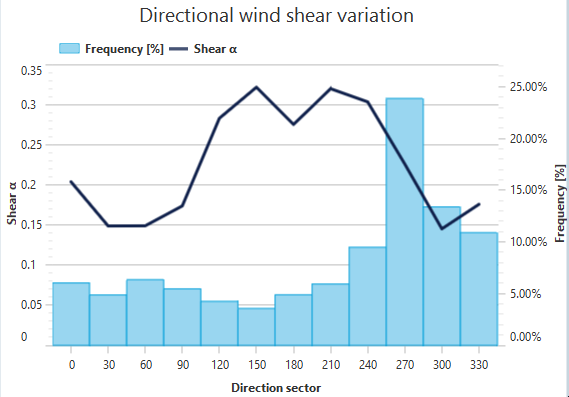
The directional wind shear variation plot can help you spot anomalies and compare them against directional frequency to understand their importance. The alpha values are derived from the mean alpha of time series alpha values that correspond to direction records within the given direction bin.
Time series wind shear variation
The time series wind shear variation plot shows the calculated alpha time series that is used to extrapolate your wind speed data to hub height. You can zoom using your mouse scroll wheel to see more detail.
Coverage for each month is shown to help you determine whether the alpha time series is reasonably continuous or not so you know how much your model will rely on a look-up table to replace missing shear alpha values.
If you are using the annual shear model this plot shows monthly shear values calculated from monthly mean wind speeds. These data are not used in the annual shear model and are for information only.
