Data cleaning
The data cleaner is an interactive time series data visualisation tool that allows you to investigate and identify causes of poor correlation and erroneous measurement behaviour then exclude periods of erroneous data that could bias energy results.
You can drag tabs on to a second monitor to view correlations, ratio plots and time series simultaneously.
Automatic cleaning workspace setup
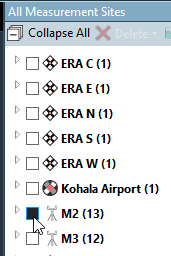
To auto-setup a workspace select the check box for a mast.

All mean wind speeds, directions, temperatures and relative humidity time series are plotted and the following plots are created automatically:
Ratio plot for every set of wind speed measurements at the same height
Correlations for:
- Wind Speeds for each height down one side of the mast, instruments are correlated based on their orientation
- Directions between the top direction sensor and other sensors or between primary and other sensors
- Correlation of temperature and relative humidity
Data cleaning hot keys and interactions
| Navigate forwards / backwards in time |
Shift + scroll |
| Right click + drag |
|
| Pager |
|
| Click overview control |
|
| Zoom |
Mouse scroll wheel |
| Edit range per page |
|
| Overview control at the bottom of the time series plot |
|
| Add exclusion |
Right click, select add exclusion |
| Delete exclusion(s) |
Select exclusion(s) and hit delete |
| Edit exclusions |
Double click to edit properties for all under cursor |
| Drag exclusion edges to edit exclusion time range |
|
| Page forwards / back |
Click in page number box, up/down arrows |
Scatter plot point filters
You can grey out data that are not relevant from the scatter plots with filters. The filtered points are always shown behind the valid data points. On a scatter plot select the settings icon to configure the filters.
Bookmarks
Add bookmarks to go save your exact cleaning configuration. Select a bookmark to continue cleaning data from the same location in later sessions.
Bookmarks are saved with an image and a note. There is a separate "Manage Bookmarks" task for reviewing data cleaning bookmarks and editing notes.
Import / export exclusions
From the Exclusions tab in Data cleaning you can import and export exclusions from a text file. The file format is tab separated text with the following columns:
| Column data | Example |
|---|---|
| Measurement site name | M2 |
| Measurement name | ws37n |
| Exclusion reason | Sensor failure |
| Exclusion start date-time | 2011-11-13 09:40:00 |
| Exclusion end date-time | 2011-11-16 23:00:00 |
| Last modified date-time | 2018-04-25 12:09:17 |
Note
Exclusion start and end times are inclusive. WindFarmer assumes time stamps are at the start of the sample period. E.g: An exclusion end time at 23:00 also excludes the 23:00 stamped record that represents data from 23:00 to 23:10.